Case study
Segment P&L Analysis of Teaching Products Across Two Markets
Six years of product-level income statements analyzed for income, direct cost and gross margin movement before, during and after Covid, presented market by market.
- Client
- Nasir
- Sector
- Education provider (teaching products)
- Location
- Singapore and Egypt markets
- Scope
- FY2019–FY2023 actuals plus FY2024 plan
- Tools
- Excel, PowerPoint
The Brief
The client wanted a separate presentation for each market showing how income and costs of its teaching products had moved across key periods, with no more than seven slides per market plus a title slide.
Movements had to be shown with line graphs, bar charts, pie charts and waterfall graphs, with the pre-Covid, during-Covid and post-Covid periods treated as distinct timeframes. Each deck had to close with the market's main challenges and opportunities: economic instability, heightened competition and changing consumer behaviour.
The Challenge
The raw data was an annual segment income statement per market: total income, then direct costs (middle management, teaching staff by contract type, substitution, direct marketing, premises, other delivery costs and allocated operational support), down to gross surplus. Each year sat on its own sheet, with product lines (adult courses including online, kids, teens, early years and other products) as columns.
Before any chart could be trusted, every year had to be mapped to the same chart of accounts and segment structure, totals had to be reconciled back to each sheet, and costs held as negatives had to be handled consistently, so year-on-year variances and margins compared like with like.
What we delivered
- One presentation per market, within the seven-slide limit
- Line, bar, pie and waterfall charts, with the Covid periods clearly separated
- A reusable analysis workbook, so the next year's income statement can be added without rebuilding the charts
What We Built
- A consolidated segment P&L per market, with every year mapped to one line structure and reconciled to source totals
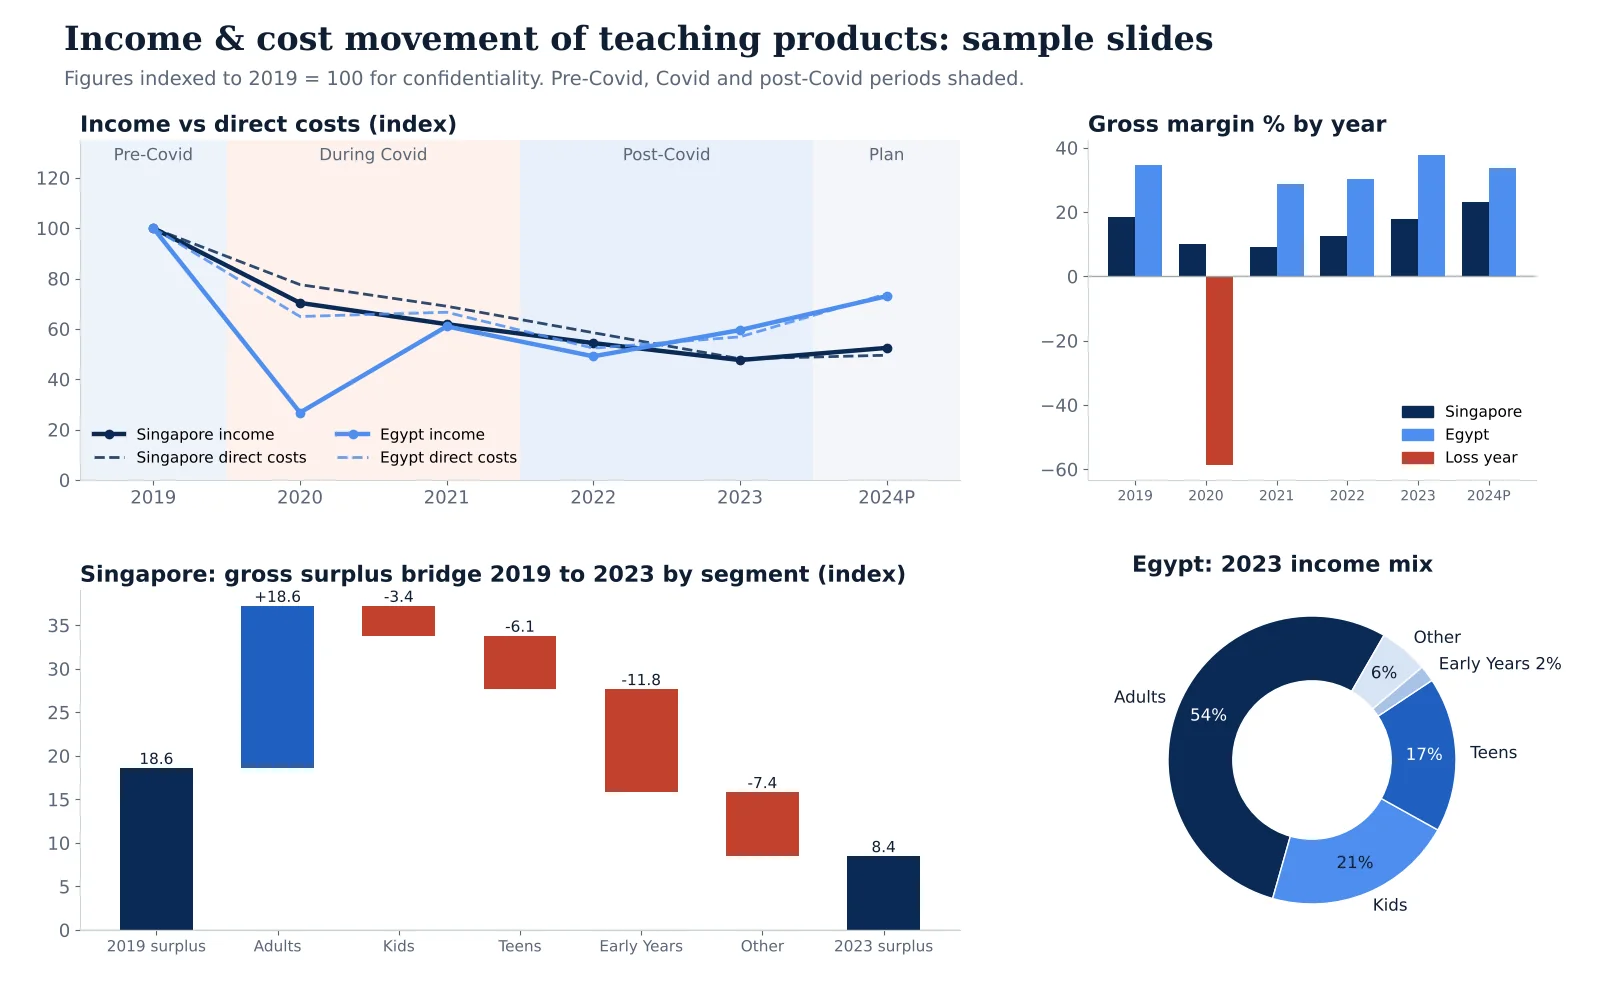
- Income vs direct cost trend lines with pre-Covid, Covid and post-Covid periods shaded
- Gross margin % and cost-to-income ratio by year, with loss years flagged
- Waterfall (variance bridge) charts showing which segments drove the change in gross surplus
- Direct cost mix analysis: staff, marketing, premises and delivery costs as a share of income
- Income mix by segment for the latest actual year and the plan year
- A challenges and opportunities slide per market, linked to the numbers
What the Analysis Showed
Singapore: income fell in every year from 2019 to 2023, ending at roughly half its pre-Covid level. Direct costs were cut faster from 2021, so gross margin recovered from about 9–10% in the Covid years to about 18% in 2023, and the 2024 plan sits above the pre-Covid margin.
The Singapore gross surplus bridge showed adult courses improving their contribution, while early years, teens and other products accounted for most of the surplus lost since 2019.
Egypt: income fell to about a quarter of the 2019 level in 2020 and the market made a gross loss, as direct costs could not be cut as quickly as income. Income recovered in 2021, and by 2023 gross margin was above its pre-Covid level, with adult courses providing just over half of income.
How We Approached It
Map and reconcile
Mapped each annual sheet to one segment and cost structure, and reconciled totals, direct costs and gross surplus back to source before charting.
Measure the right things
Calculated year-on-year variances, gross margin, cost-to-income ratios and each segment's contribution, plus actual-versus-plan movement for 2024.
Tell the story by period
Grouped years into pre-Covid (2019), during Covid (2020–2021), post-Covid (2022–2023) and plan (2024), with consistent colours and a one-line takeaway on every slide.
Accounting Terms in This Project
- Segment reporting
- Income and costs reported separately for each product line, so management can see which products carry the business.
- Gross surplus and gross margin
- Income minus direct costs, in money and as a percentage of income.
- Variance bridge (waterfall)
- A chart that walks from one period's result to another, showing each segment's positive or negative contribution.
- Cost-to-income ratio
- Direct costs as a share of income: a quick read on how efficiently each market delivers.
- Actual vs plan
- Comparing the budget or plan year with actual results to judge whether forecasts are realistic.
More Case Studies
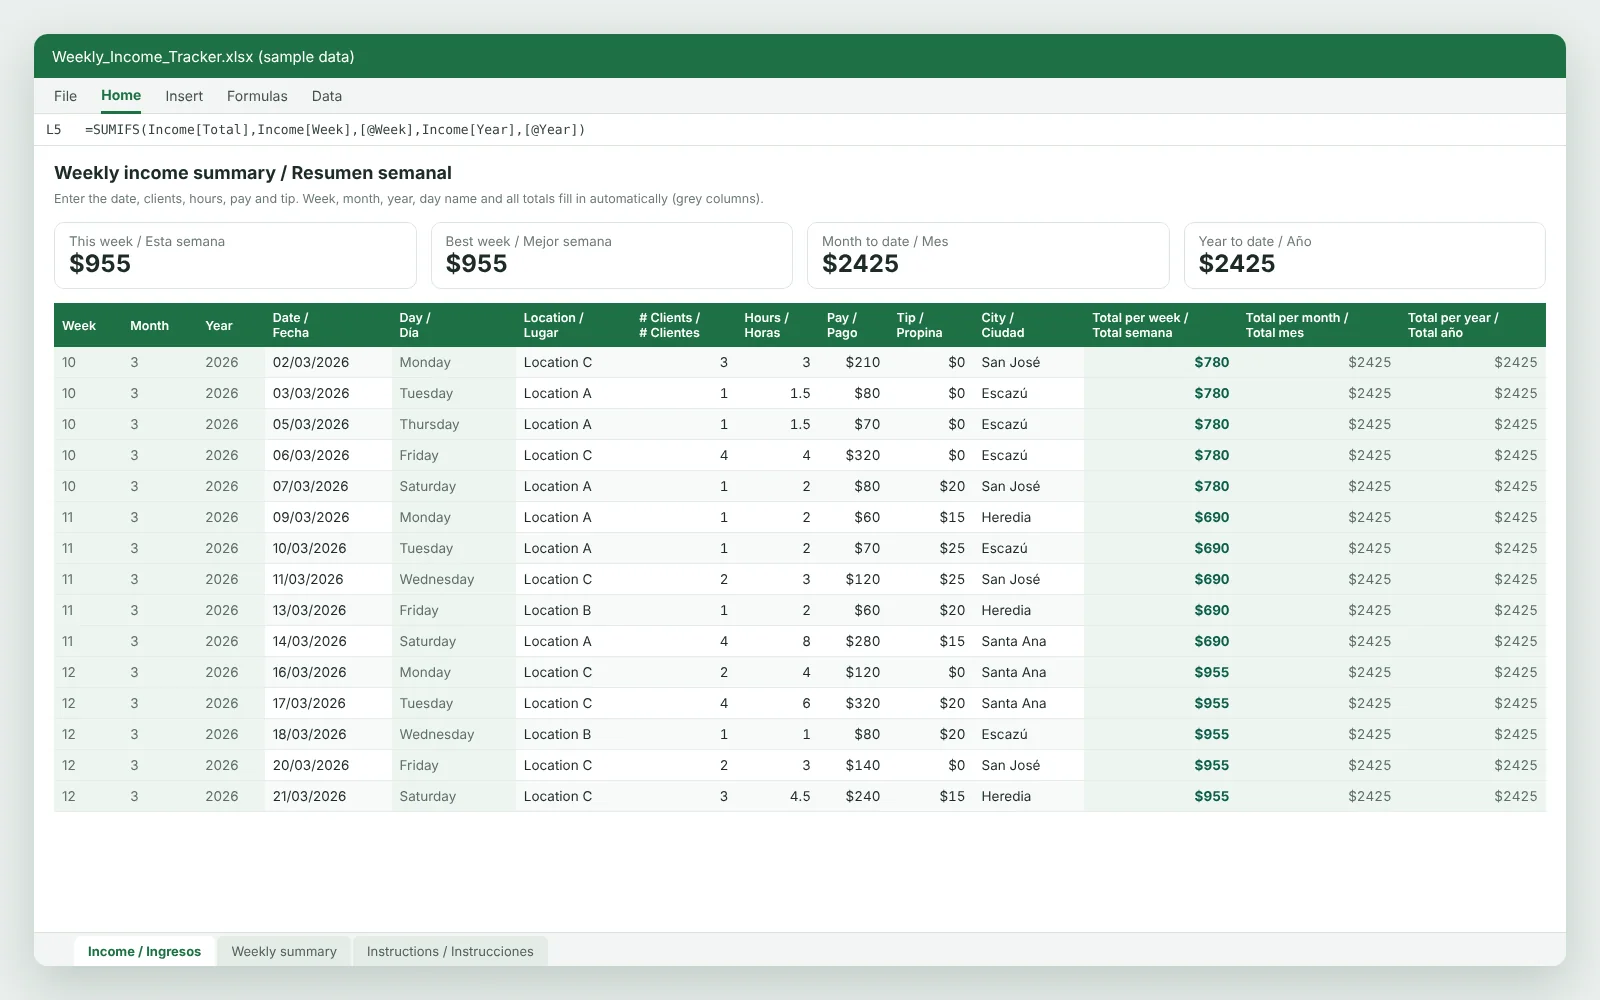 Self-employed income records
A Bilingual Income Ledger With Weekly, Monthly and Yearly Totals
A one-sheet English and Spanish income ledger that rolls daily pay and tips up into weekly, monthly and year-to-date totals.
Read the case study →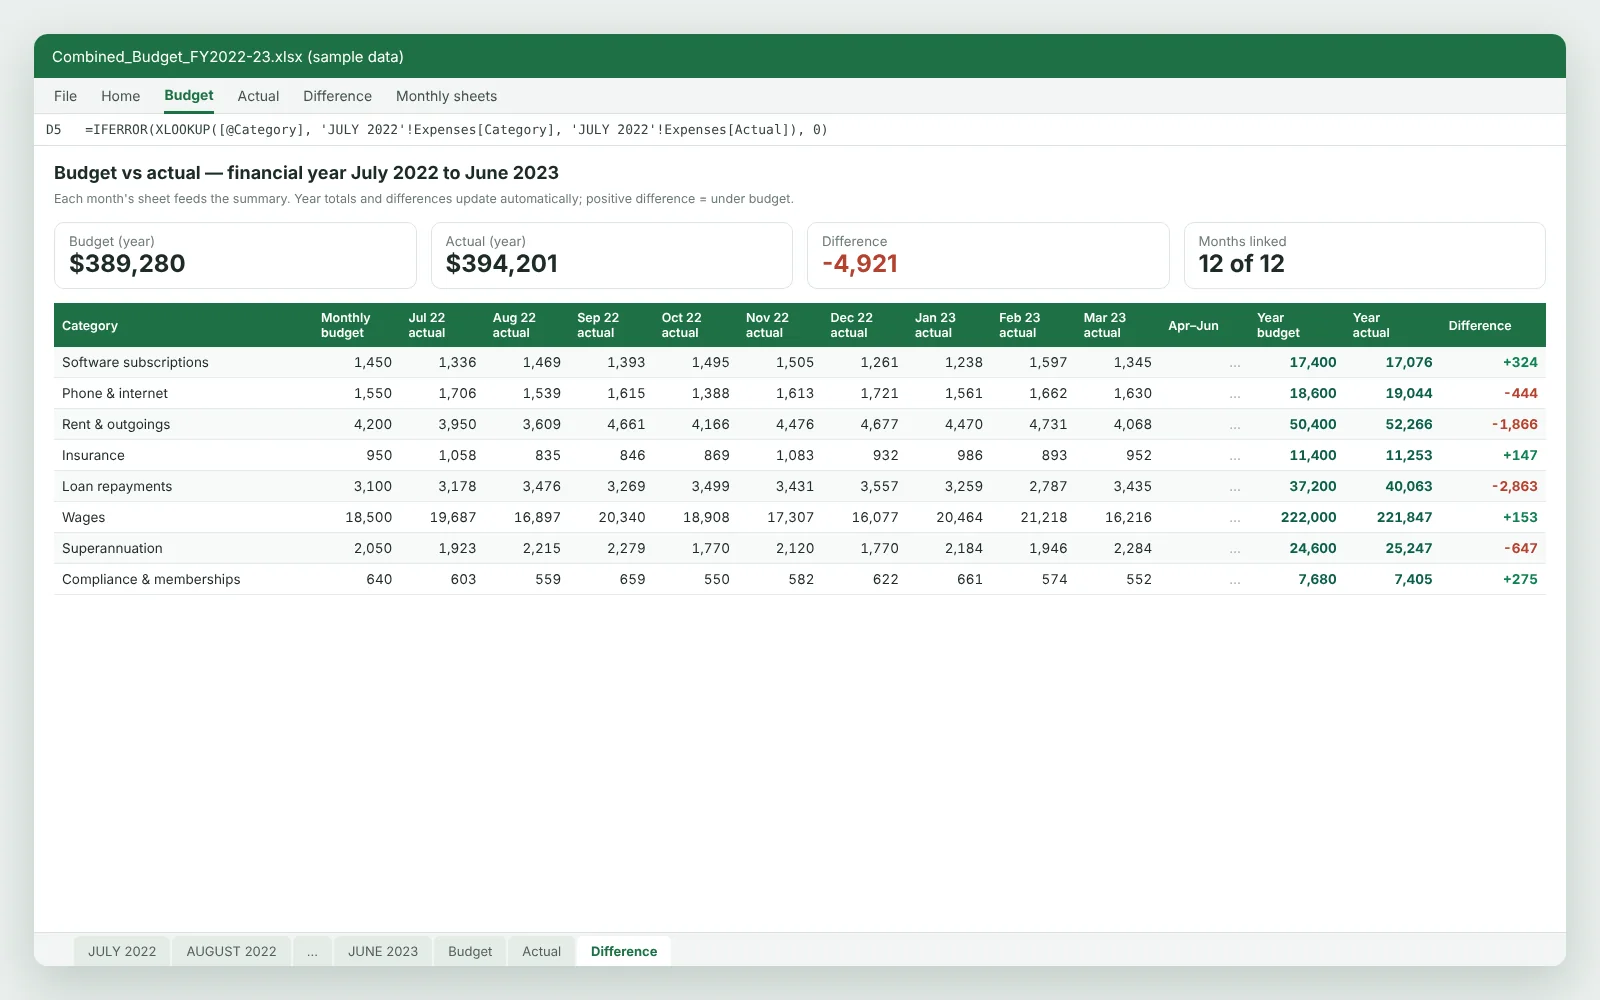 Group of Australian advisory businesses
Rolling a Combined Budget vs Actual Workbook Into a New Financial Year
A multi-entity budget workbook rebuilt for a new July–June financial year, with monthly budget vs actual figures, full-year totals and variance analysis.
Read the case study →Have a similar job?
Send us the file or a short description. You'll get a fixed price within a few business hours.
Hire an Excel Accounting Expert